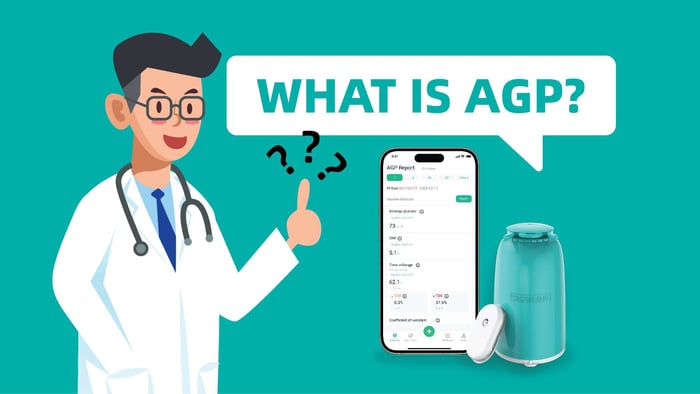
In the ever-evolving landscape of diabetes management, Ambulatory Glucose Profile (AGP) report serves as a beacon of clarity, offering a full picture of glucose trends and patterns over a specified time frame. Interpreting AGP report correctly is the key to unlocking valuable insights that can guide individuals and healthcare professionals in optimizing diabetes care.
Demystifying the AGP Graph:
The AGP graph is a visual representation of continuous glucose monitoring (CGM) data, capturing the ebb and flow of glucose levels throughout a day. Let's break down the key elements that make up this graph:

Time in Range (TIR):
This segment indicates the percentage of time spent within the target glucose range, typically between 70-180 mg/dL. A higher TIR suggests better glycemic control, while a lower percentage may signal the need for adjustments in treatment plans.
Time Below Range (TBR) and Time Above Range (TAR):
TBR shows the duration of low glucose levels, while TAR represents the time spent with elevated glucose levels. Monitoring these metrics helps identify potential hypoglycemic episodes and hyperglycemic spikes, guiding adjustments in insulin dosage, dietary choices, and other treatment strategies.
Time CGM Active:
The number of hours the CGM collected data, divided by number of hours in report.
Average Glucose:
All of your glucose values added together, divided by the number of your total readings.
GMI (glucose management indicator):
Calculated from your average glucose; estimates the anticipated laboratory A1C level.
Glucose Variability:
This indicates the frequency of glucose fluctuations. Ideally, a variability value of less than 36% is associated with more stable glucose levels, implying effective glucose control.
Heavy Line:
The median (middle) line where half of the glucose values are above and half are below; ideally, the line is should be mostly flat and inside the green target range area of 70-180 mg/dL.
Darker Shading:
The area shaded darker shows 50% of the glucose values; ideally, the space between is narrow.
Lighter Shading:
5% of values are above (95% top line) and 5% are below (5% bottom line); ideally, the closer the lighter shaded area is to the darker shaded area, the better.
Daily Glucose Profile:
Each daily glucose profile represents a single day's glucose pattern during a midnight-to-midnight (24-hour) period. If readings are:
Above the Shaded Area (High): the person could have trouble with healing from infections and have a higher tendency of developing complications.
Below the Shaded Area (Low): the person could feel shaky, weak or confused.
Important Steps to Interpret Your AGP Report:
1. Review Your TIR:
Start by assessing the Time in Range. Aiming for a TIR close to 100% is ideal, but realistic targets can be set based on individual circumstances.
2. Identify Patterns:
Look for recurring patterns in the graph, such as consistent highs or lows at specific times of day. These patterns can inform adjustments to medication, diet, or exercise routines.
3. Address Variability:
Examine the glucose variability to identify periods of instability. Strategies to minimize variability may include adjusting insulin doses, portion size of meals, or incorporating regular physical activity.
4. Evaluate Post-Meal Spikes:
Focus on post-meal spikes and correlate them with your specific food choices. This information should help you make healthier choices about your diet and more informed insulin dosage adjustment.
Collaborate with Healthcare Professionals:
Interpreting the AGP is a collaborative effort between your and your healthcare team. The SIBIONICS app allows you easily download your AGP reports or email them to your healthcare professionals.

Conclusion:
As we celebrate the accessibility and insights provided by the Ambulatory Glucose Profile, mastering its interpretation becomes an empowering tool for individuals managing diabetes. By delving into the nuances of the AGP graph, both patients and healthcare providers can work together to refine diabetes management strategies, promote better glucose control, and ultimately enhance the quality of life. Embrace the AGP reports as a guiding compass on your path to optimal health!
SIBIONICS GS1 CGM-Continuous Glucose Monitoring System

€62,99
14-Days Continuous Glucose Monitoring Highly Accurate Sensor Readings Exportable AGP Reports Shareable Real-Time Glucose Data Customizable Glucose Alarm User-friendly App Calibration Free No Scanning IP28 Waterproof … read more
References:
CGM AGP Report (Continuous Glucose Monitor) - v5.0